


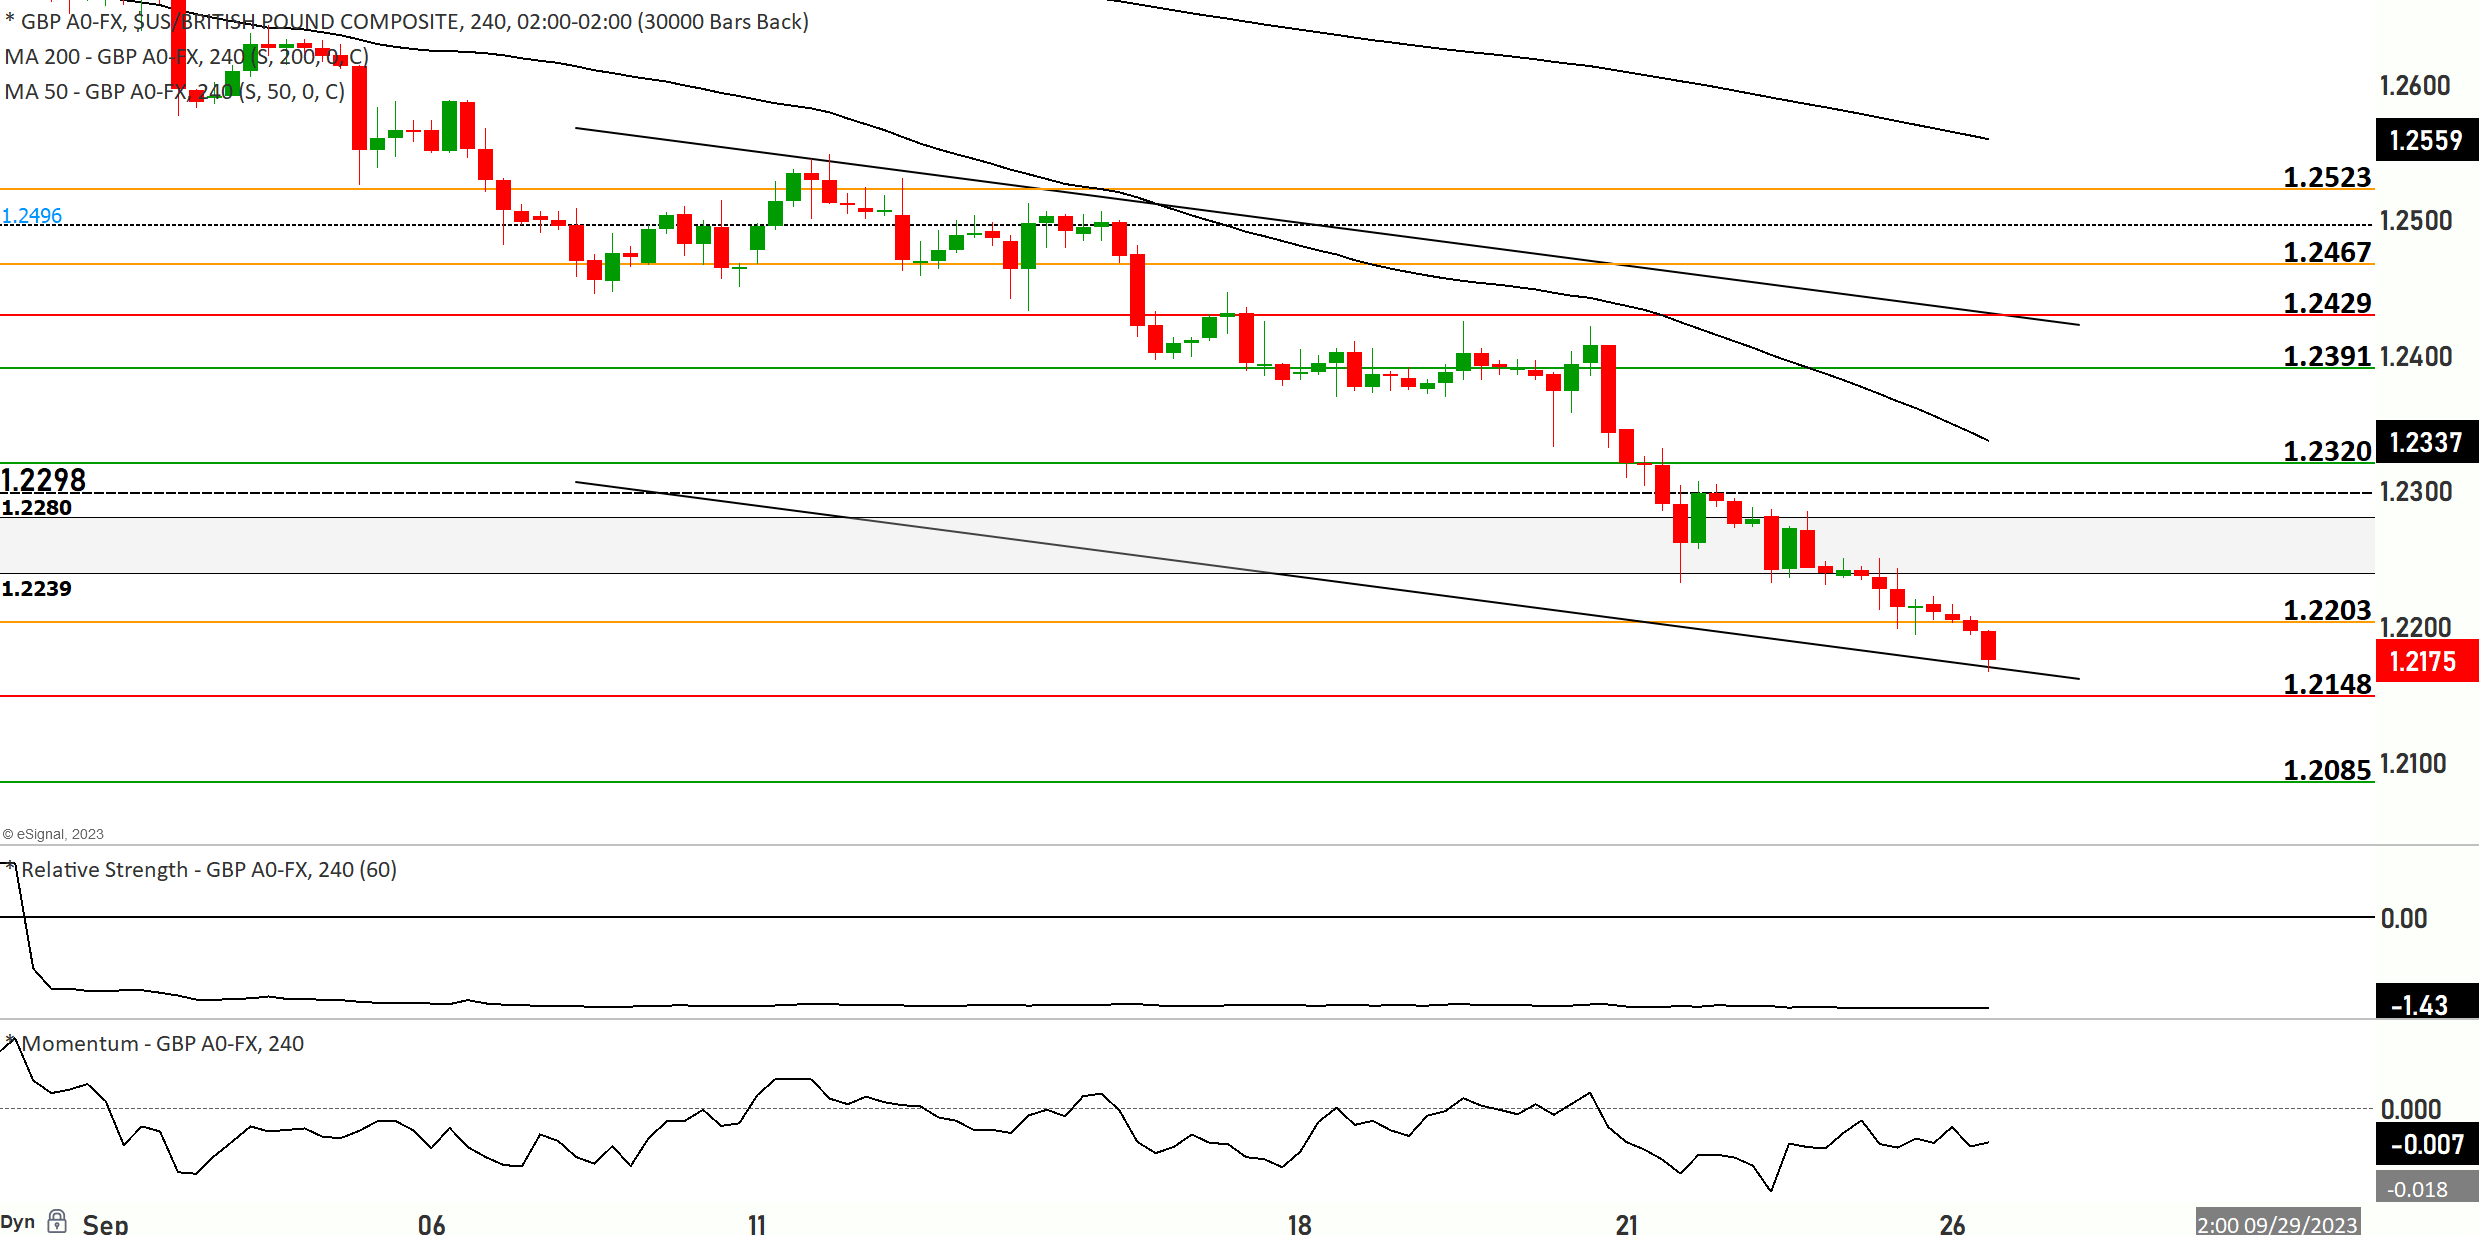

GBP/USD is presently on a short-term bearish downtrend, facing pressures from a strengthening U.S. dollar, which has risen by 0.1%. This is corroborated by the pair’s trading below the 200 and 50-day moving averages. Notably, the recent fluctuations have been within a tight range of 1.2195-1.2216, reflecting an absence of significant local influences and a higher impact of external factors such as the U.S. dollar and broader market risk sentiment.
GBP/USD is testing the support levels around 1.2202.
A move upwards could see the pair targeting 1.2228 in the short run, with potential to push further to 1.2263. The uppermost resistance is seen at the 1.2303 mark.
A bearish continuation could drive prices downwards to find support at 1.2172 and then closer to 1.2148. Failing to hold these levels could lead to deeper dives, targeting 1.2120, which stands out as a significant support. A breakdown from here might see the pair heading to the psychological 1.2000 level.
The current price is below the 5, 10, and 21-day MAs, intensifying the bearish outlook. Any reversal in this outlook would likely need the price to breach the 200 DMA at 1.2434.
The RSI is in the oversold territory, which sometimes indicates an upcoming bullish pullback or consolidation. However, the current positioning of RSI also aligns with the overall bearish bias of the market.
Rising U.S. Treasury yields in Asia have contributed to the USD’s strength. There’s also an evident lack of major UK data releases or Bank of England (BoE) speeches, making the pair more susceptible to external influences. The ongoing Covid scenario in the UK, leading to a rise in sick leaves, is an additional factor to monitor as it could impact broader economic metrics.
n the near term, the market is likely to oscillate between the 1.2148 to 1.2333 levels. It’s essential to closely observe how the price behaves upon reaching these significant zones.