Candlestick patterns are a technical trading tool used to predict price direction in financial markets. They are created by up and down movements in the price, which sometimes form patterns that traders use for analysis or trading purposes. These patterns are separated into bullish and bearish categories, where bullish patterns indicate that the price is likely to rise, and bearish patterns suggest that the price is likely to fall. There are many candlestick patterns, and they help forecast the short-term direction of the price.
Importance of recognizing patterns in trading:
Recognizing trading patterns is a crucial skill in trading as it helps traders identify shifts between rising and falling trends. By looking for patterns in the prices of traded instruments, traders can spot changes in the market’s trend and execute trades based on these signals. Patterns are essential factors to consider when calculating where to enter, set stop-loss orders, and where to set profit targets, which are key aspects that all traders need to consider when managing their overall portfolio. Moreover, recognizing patterns can help traders develop their strategies and make more informed trading decisions.
Interpretation
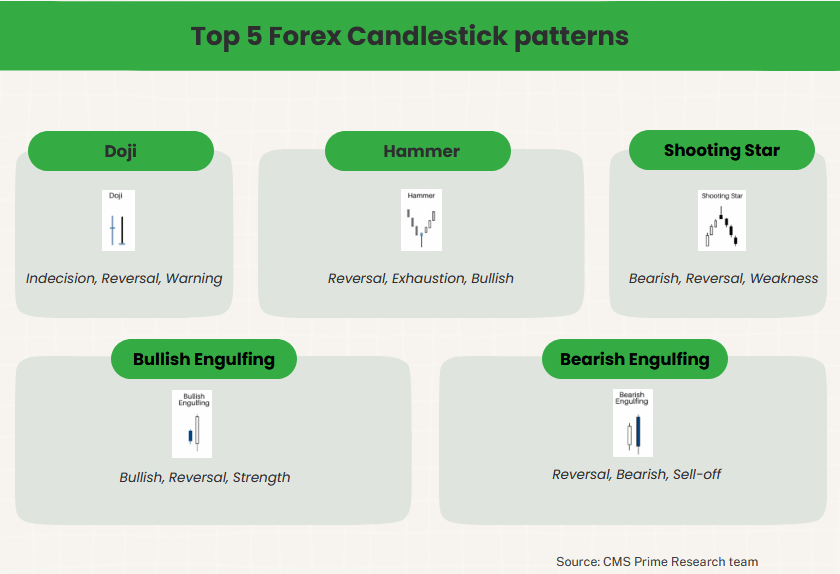
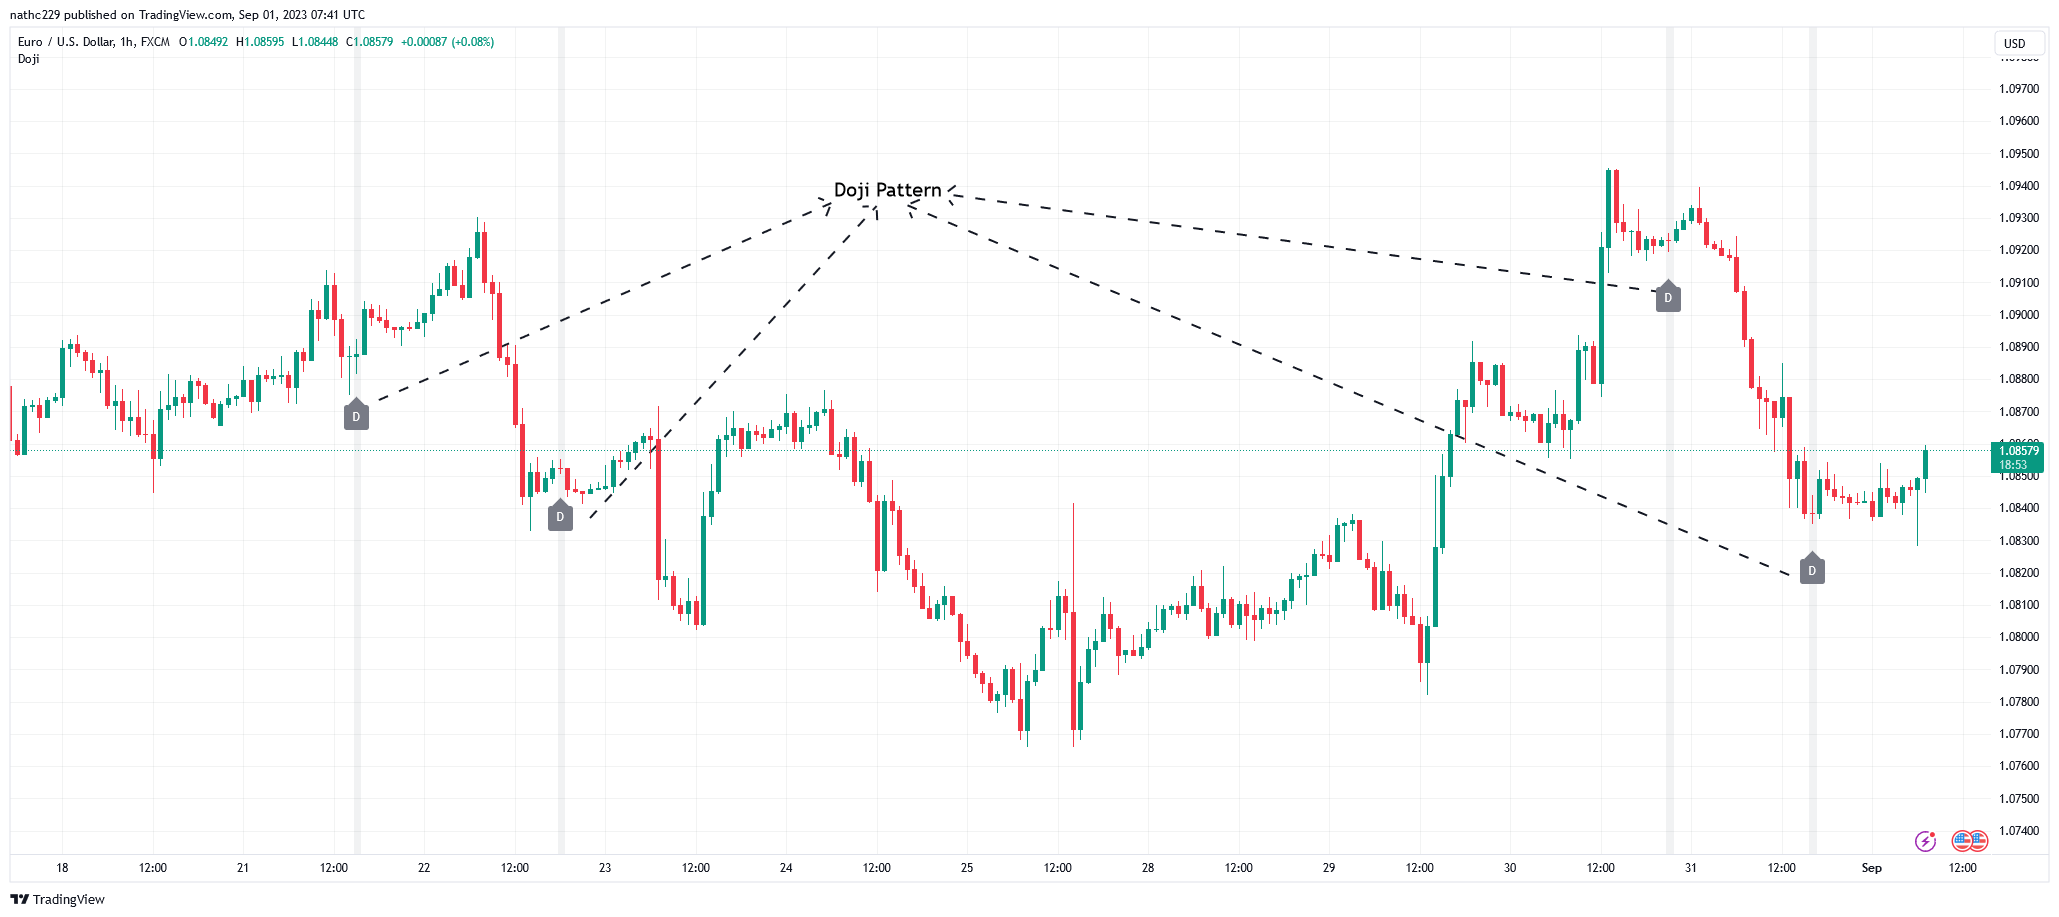
The Doji candlestick pattern indicates indecision in the market, with neither buyers nor sellers taking control during the candlestick’s time period. It suggests a potential reversal or trend change may be developing, especially after a sustained trend. Dojis are significant because they can mark potential turning points and alert traders to a shift in momentum.
Significance
However, the pattern alone does not guarantee a reversal – it must be considered in the larger technical context. Overall, the Doji acts as a warning sign of waning momentum that could precede a trend change if confirmed by other indicators. Traders watch for Dojis to identify potential entry and exit points around support and resistance levels.
Chart Analysis
Description and Key Features
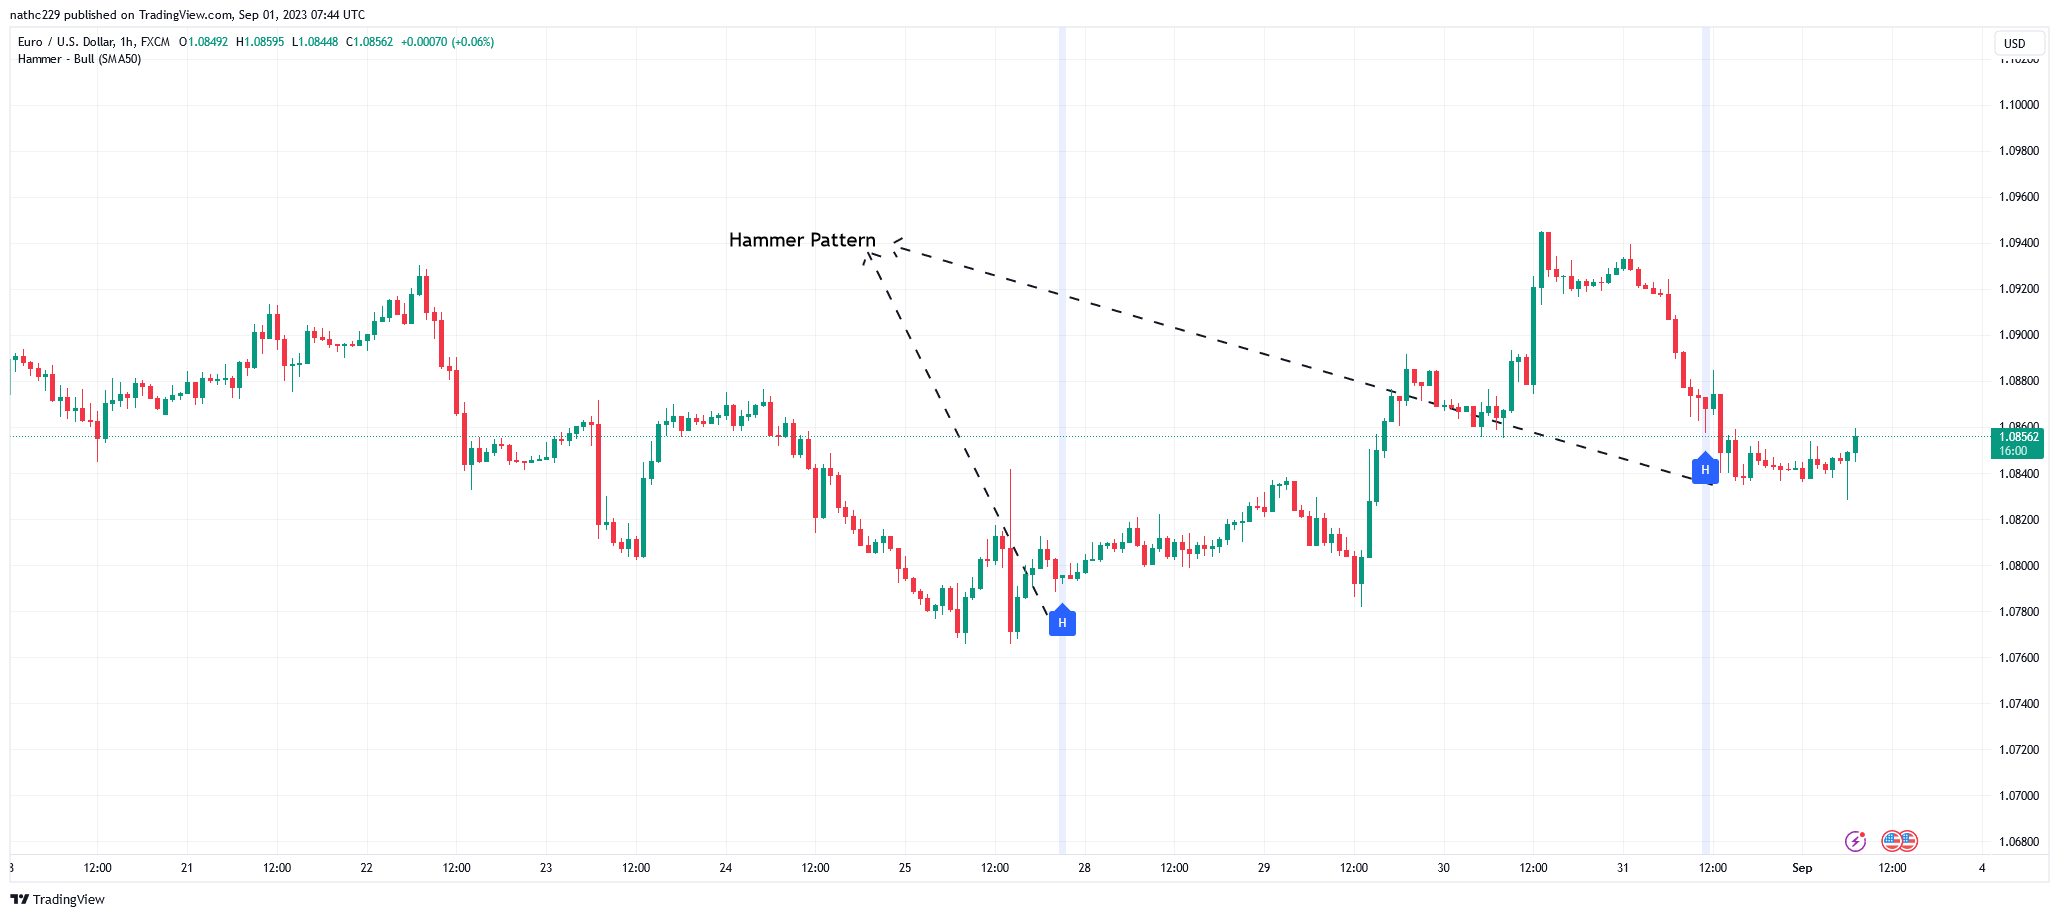
The hammer candlestick pattern is a single-candle formation that indicates a potential reversal from a downtrend to an uptrend. It is formed when price opens, drops significantly lower, but then closes near the open price again. The candle has a small real body at the top and a long lower wick or “tail”. The body color is unimportant, though a white body hints at more bullishness.
Key features:
– Small real body at top of range
– Long lower wick – at least 2x body height
– Formed in a downtrend
How to Identify a Hammer
To identify a hammer, look for a candle with a small body at the top and a long lower tail in a downtrend. The tail should be at least 2x the height of the body. The upper wick can be small or nonexistent.
Application in Bullish Reversals
The hammer signals potential exhaustion of the downtrend as buyers step in, hence its use for bullish reversals. However, a hammer alone does not guarantee a reversal – consider other indicators for confirmation. Entry can be on close of the hammer or on next bullish confirmation candle close. Place stop loss below hammer low.
Illustrative Case Studies
In this EURUSD 1hr chart, a hammer formed after a downtrend as buyers stepped in.
Understanding the Shooting Star Pattern
The shooting star is a single-candlestick bearish reversal pattern that forms after an uptrend. It has a small real body near the lows and a long upper wick that is at least 2 times the size of the body. The long upper wick shows that buyers initially pushed the price higher but sellers then stepped in and drove the price back down near the open by the candle close. This hints that the uptrend may be ending as bears gain control.
Recognizing Bearish Reversals
To identify a shooting star, look for a candle with a small body and long upper wick that exceeds 2x the body size in an uptrend. The large upper wick shows strong rejection of higher prices. A shooting star alone does not guarantee a reversal but alerts to a potential trend change. Consider other indicators like volume for confirmation.
Real-world Examples of Shooting Stars in Currencies
In this USD/JPY 5 Min Chart, a shooting star formed after an uptrend as bears took over, leading to a drop as expected.
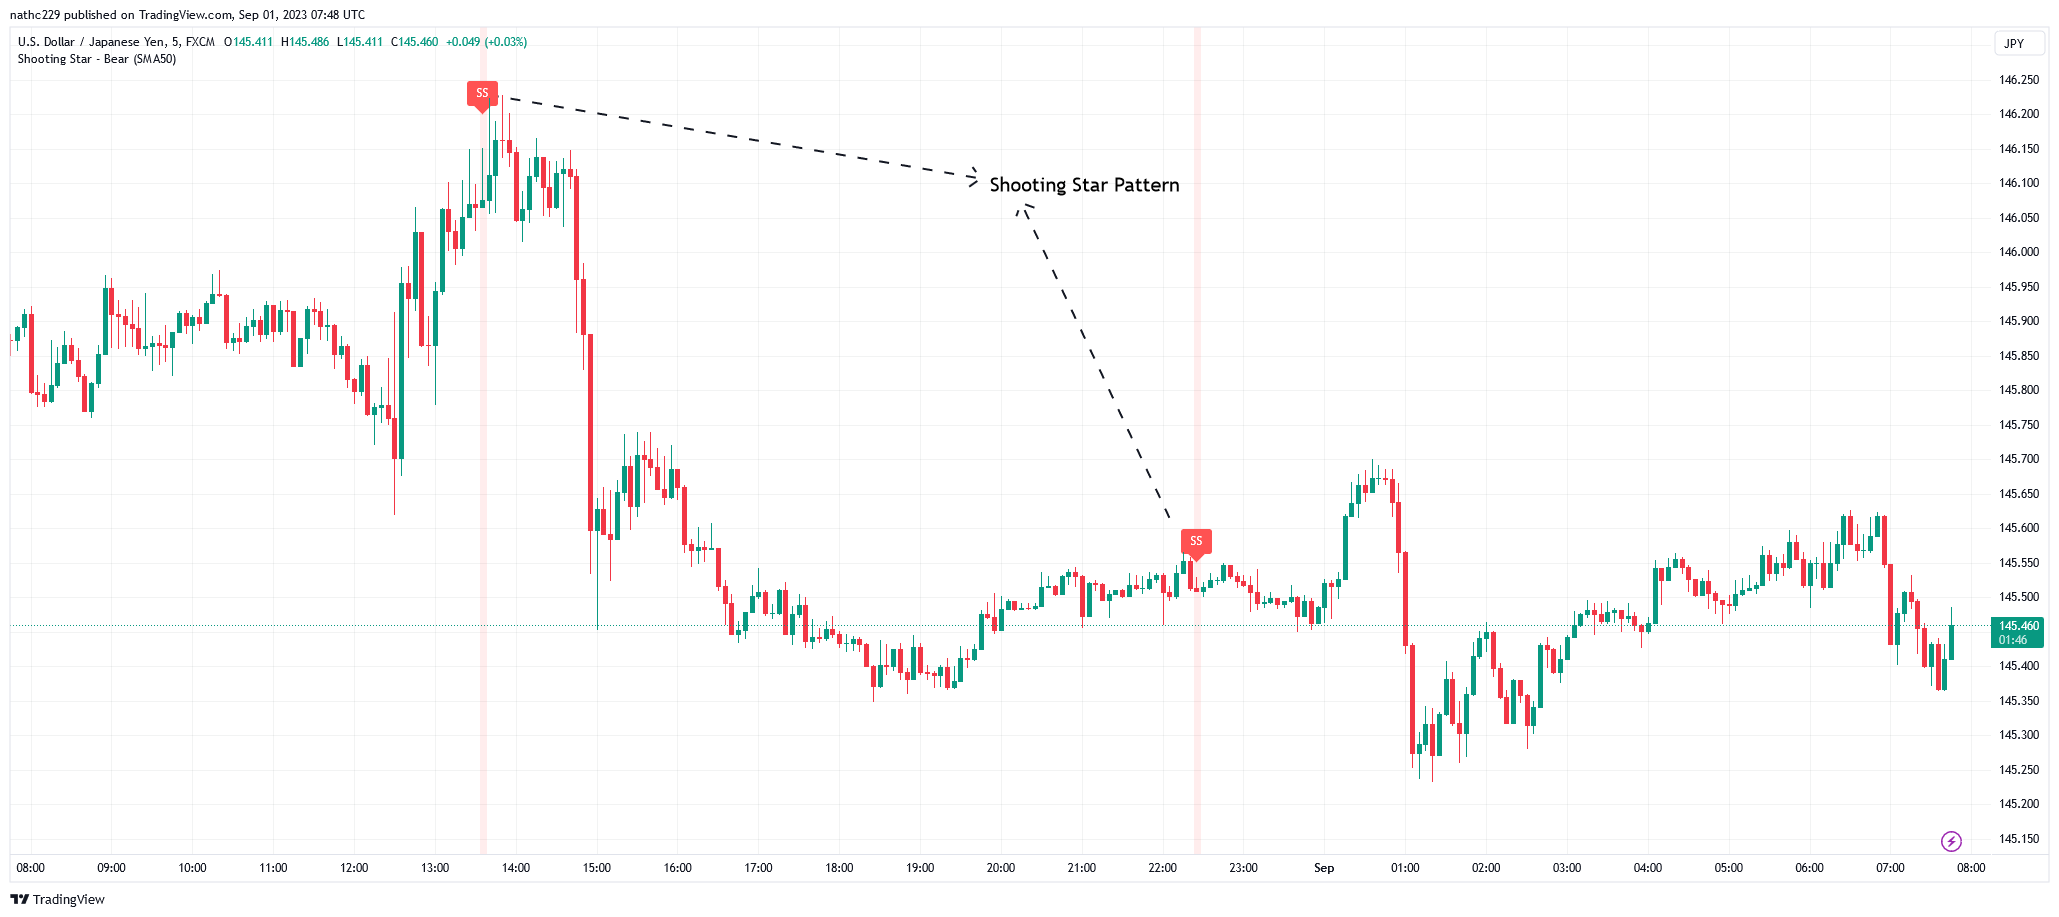
The shooting star is most significant around resistance levels and when confirming indicators align. It can alert traders to potential trend weakness and reversal points.
Exploring the Bullish Engulfing Pattern
The bullish engulfing pattern is a two-candle reversal formation that signals a potential trend change from bearish to bullish. It occurs after a downtrend and consists of a small red candle followed by a large green candle that engulfs or “covers” the body of the previous candle, showing strong buying pressure.
Key features:
– Small red candle during a downtrend
– Large green candle engulfs body of red candle
– Bullish signal after downtrend
Conditions for a Bullish Reversal
For a valid bullish reversal, the green candle’s close should be above the red candle’s open. A large green candle signals buyers have overwhelmed sellers. Volume should expand on the bullish candle for confirmation.
Practical Instances
In this USD/JPY 5 Minute chart, a bullish engulfing pattern formed after a downtrend, leading to a reversal up as expected.
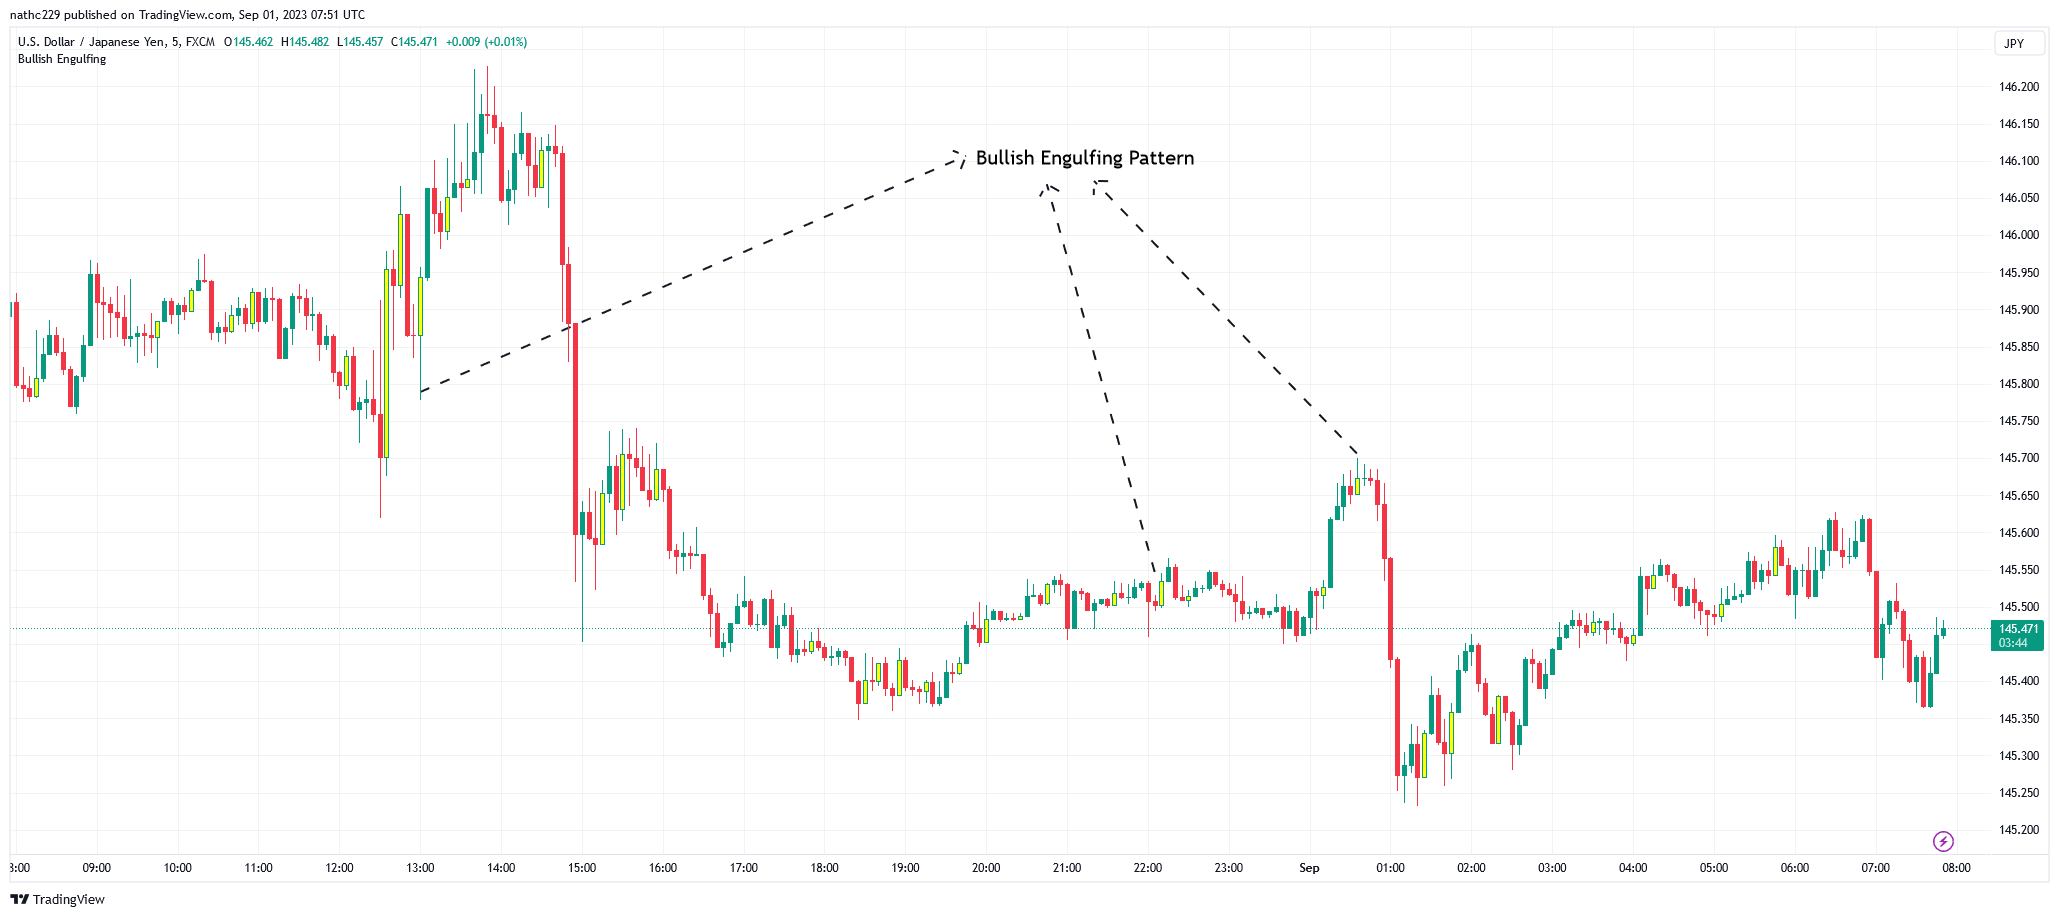
The bullish engulfing is most significant at support levels or after prolonged declines. It alerts to potential trend exhaustion and reversal points. Other indicators should confirm the signal.
Analyzing the Bearish Engulfing Pattern
The bearish engulfing pattern is a two-candlestick formation that signals a potential trend reversal from bullish to bearish. It occurs after an uptrend and consists of a small green candle followed by a large red candle that engulfs the body of the previous candle, indicating strong selling pressure.
Key features:
– Small green candle during an uptrend
– Large red candle engulfs the body of the green candle
– Bearish signal after an uptrend
Identifying Potential Downtrends
To identify a potential downtrend, traders look for lower lows and lower highs in price action. A downtrend is characterized by a series of lower lows and lower highs, indicating that sellers are in control of the market. Traders can use trend lines, moving averages, and other technical indicators to help determine the direction of the trend and identify potential reversals.
Technical Demonstration of Bearish Engulfing in Forex
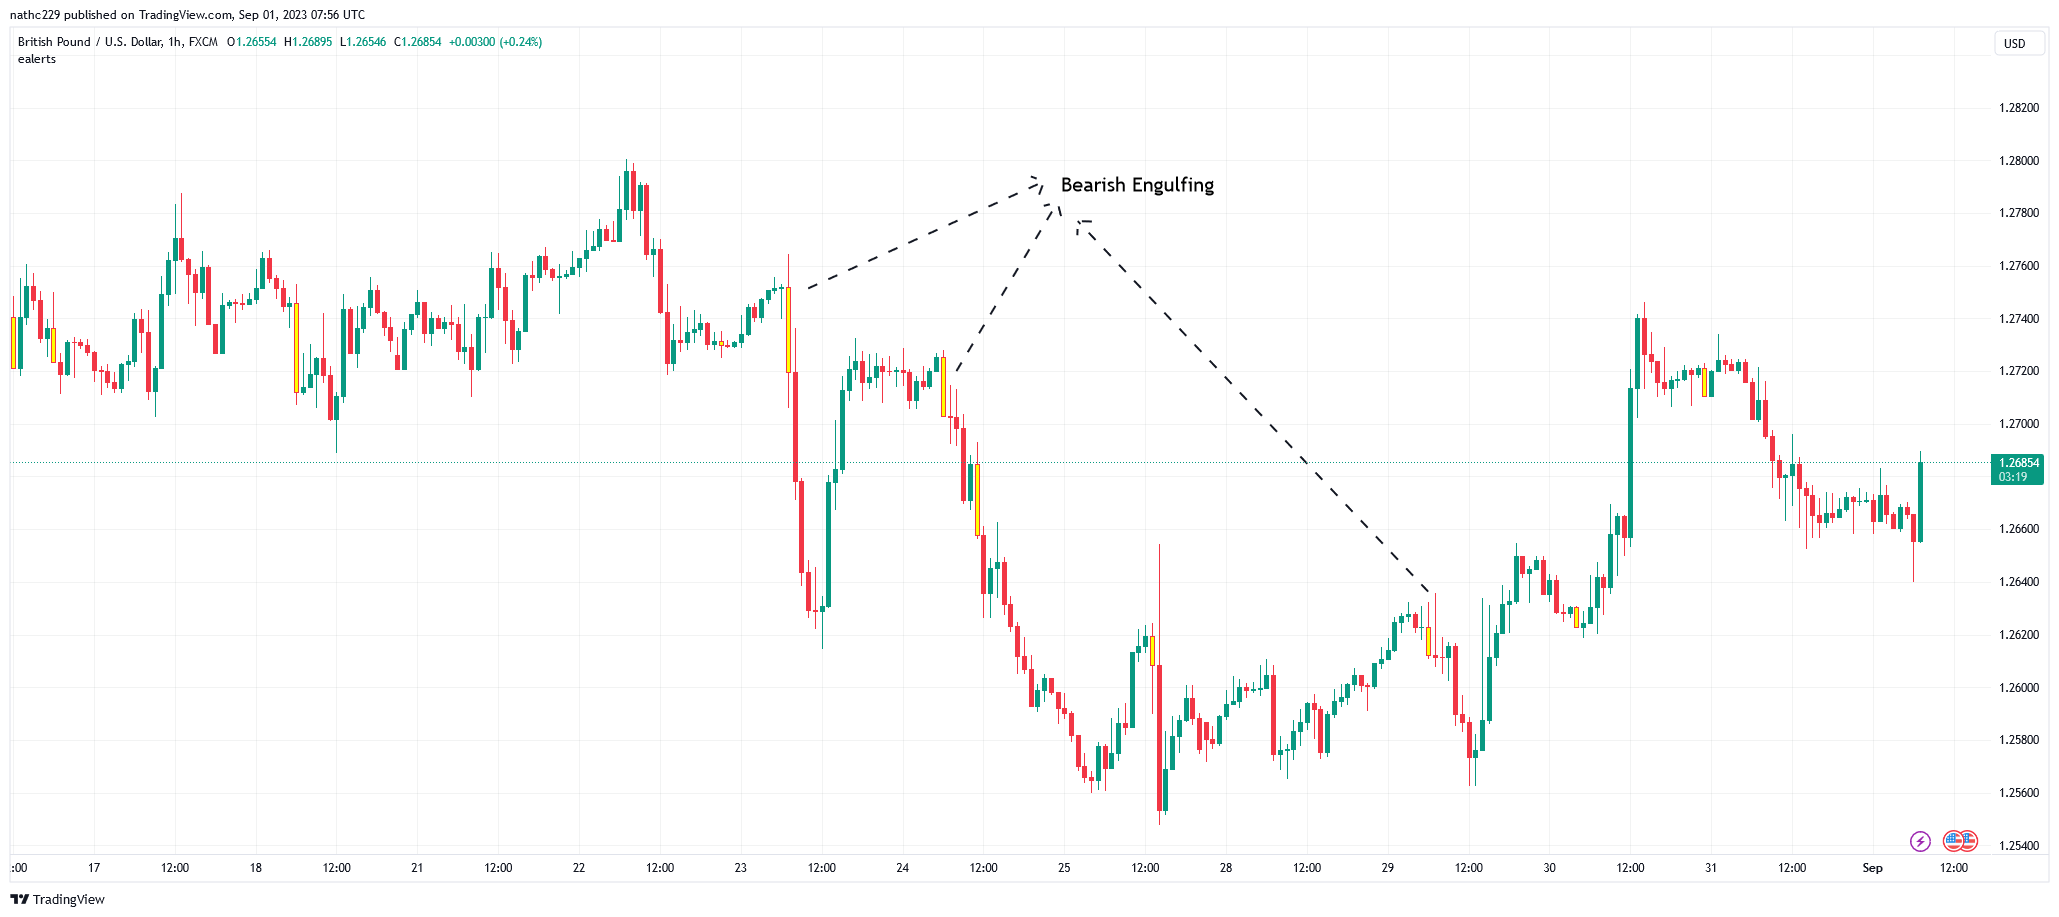
It is important to note that bearish engulfing patterns should be considered in conjunction with other technical indicators and market context for confirmation. Trading the bearish engulfing pattern effectively involves adhering to prudent risk management principles and considering the overall technical context.