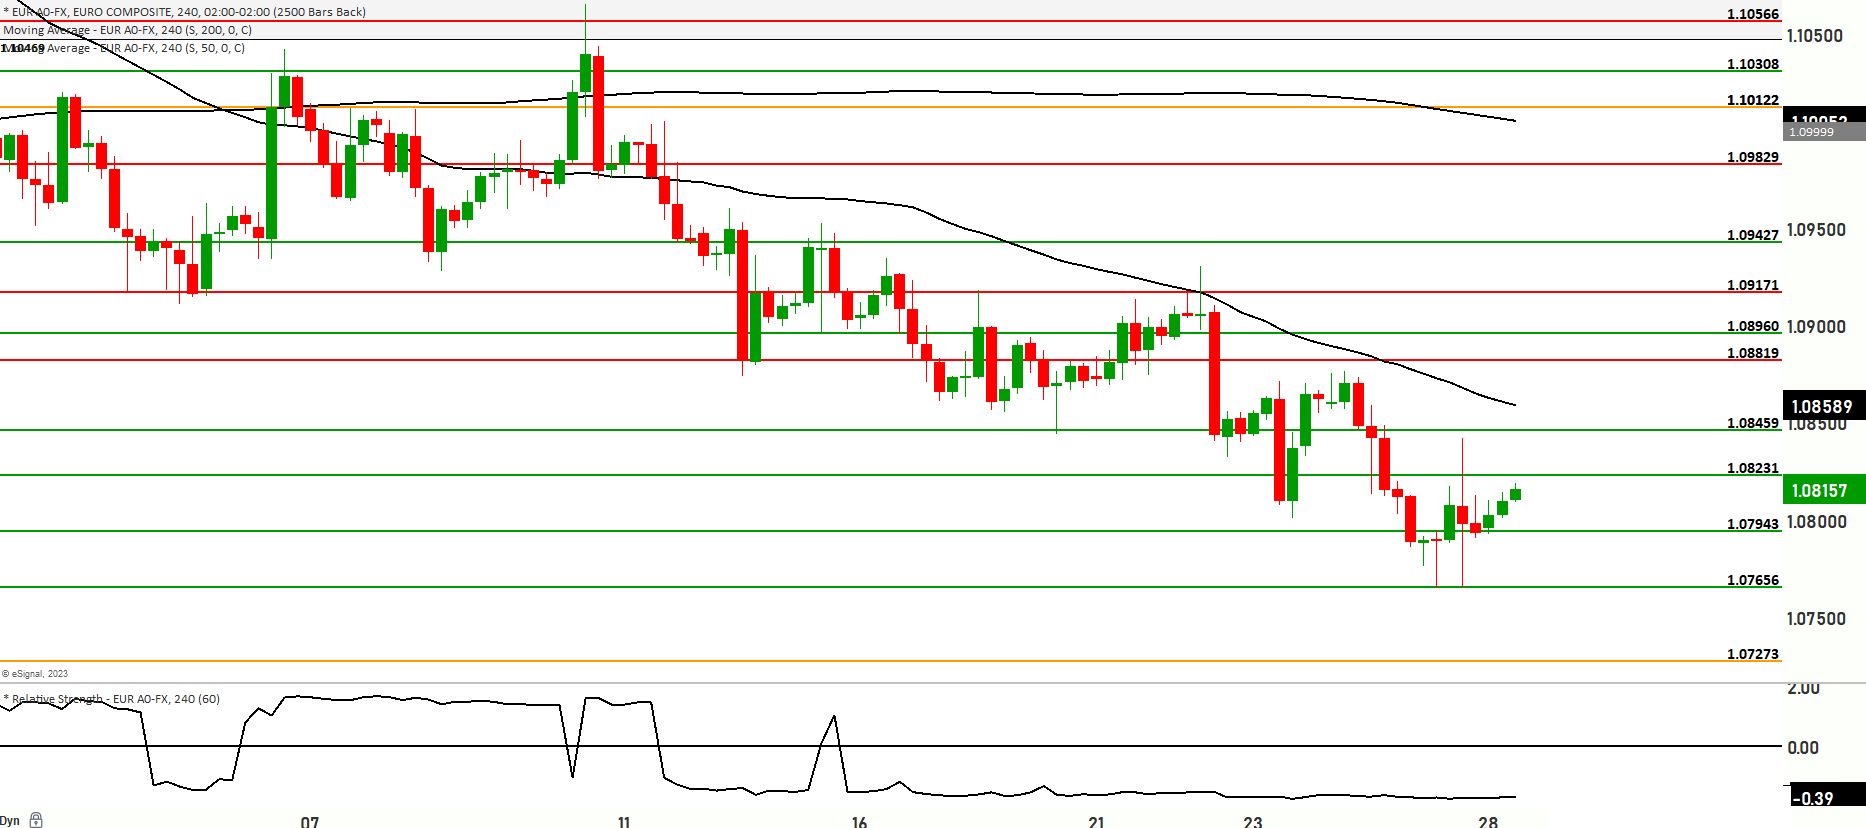
EUR/USD Gains Momentum in Asia as USD Softens Amid Risk Asset Rise. Potential test to Resistance at 1.08460


The EUR/USD pair is currently exhibiting a bearish momentum on the weekly timeframe and bullish momentum on the Daily in the short term. The price is positioned below the 50 and 200-day moving averages, indicating a prevailing bearish trend with the market taking into consideration the Christine Lagarde’s speech at the Jackson Hole Symposium and the uncertainty surrounding it, who has emphasized the need to sustain high interest rates in order to address inflation effectively. Despite progress in curbing inflation, there remains work to be done, reflecting the ECB’s commitment to maintaining price stability. The central bank’s proactive monetary policy, as evident in the significant benchmark rate increase from -0.5% to 3.75% within a year, showcases their dedication to tackling inflation-related challenges and promoting economic expansion across EU member states.
Scenario 1: Bullish Momentum
If the price continues to rise, a retest of the 1.08231 level could be in play. A successful test at this level might lead to further upward movement towards the 1.0860 and 1.08687 levels. Subsequently, the price could target the 1.08819 level. The potential for further upside remains with resistance levels at 1.09005 and 1.09171.
Scenario 2: Bearish Reversal
Alternatively, a reversal from current levels might drive the price lower, testing the 1.07943 level. A successful test at this support level could trigger further downward movement towards the 1.07802 level. The next significant support is at 1.07656. Depending on market sentiment, the price could potentially explore the range between 1.07273 and 1.07091. Key support levels to monitor are situated at 1.06889, and a breach of this could lead to a more bearish sentiment, targeting the major support level at 1.06700.
The Relative Strength Index (RSI) currently indicates a bearish oversold range, suggesting that selling pressure has pushed the market into oversold territory. However, there has been a decrease in momentum on the weekly timeframe, which could indicate potential shifts in price direction.
While Christine Lagarde’s statements and the ECB’s monetary policy emphasize the importance of sustained high interest rates to combat inflation, the technical analysis reveals a current bearish momentum on the weekly time frame but bullish on Daily time frame. As always, market sentiment and unexpected developments should be taken into consideration when making trading decisions.
Key Levels to watch are 1.08231,1.07892,1.07656,1.07273,1.09005
| Levels | Support | Resistance |
|---|---|---|
| Level 1 | 1.07943 | 1.08231 |
| Level 2 | 1.07656 | 1.08459 |
| Level 3 | 1.07273 | 1.09005 |
