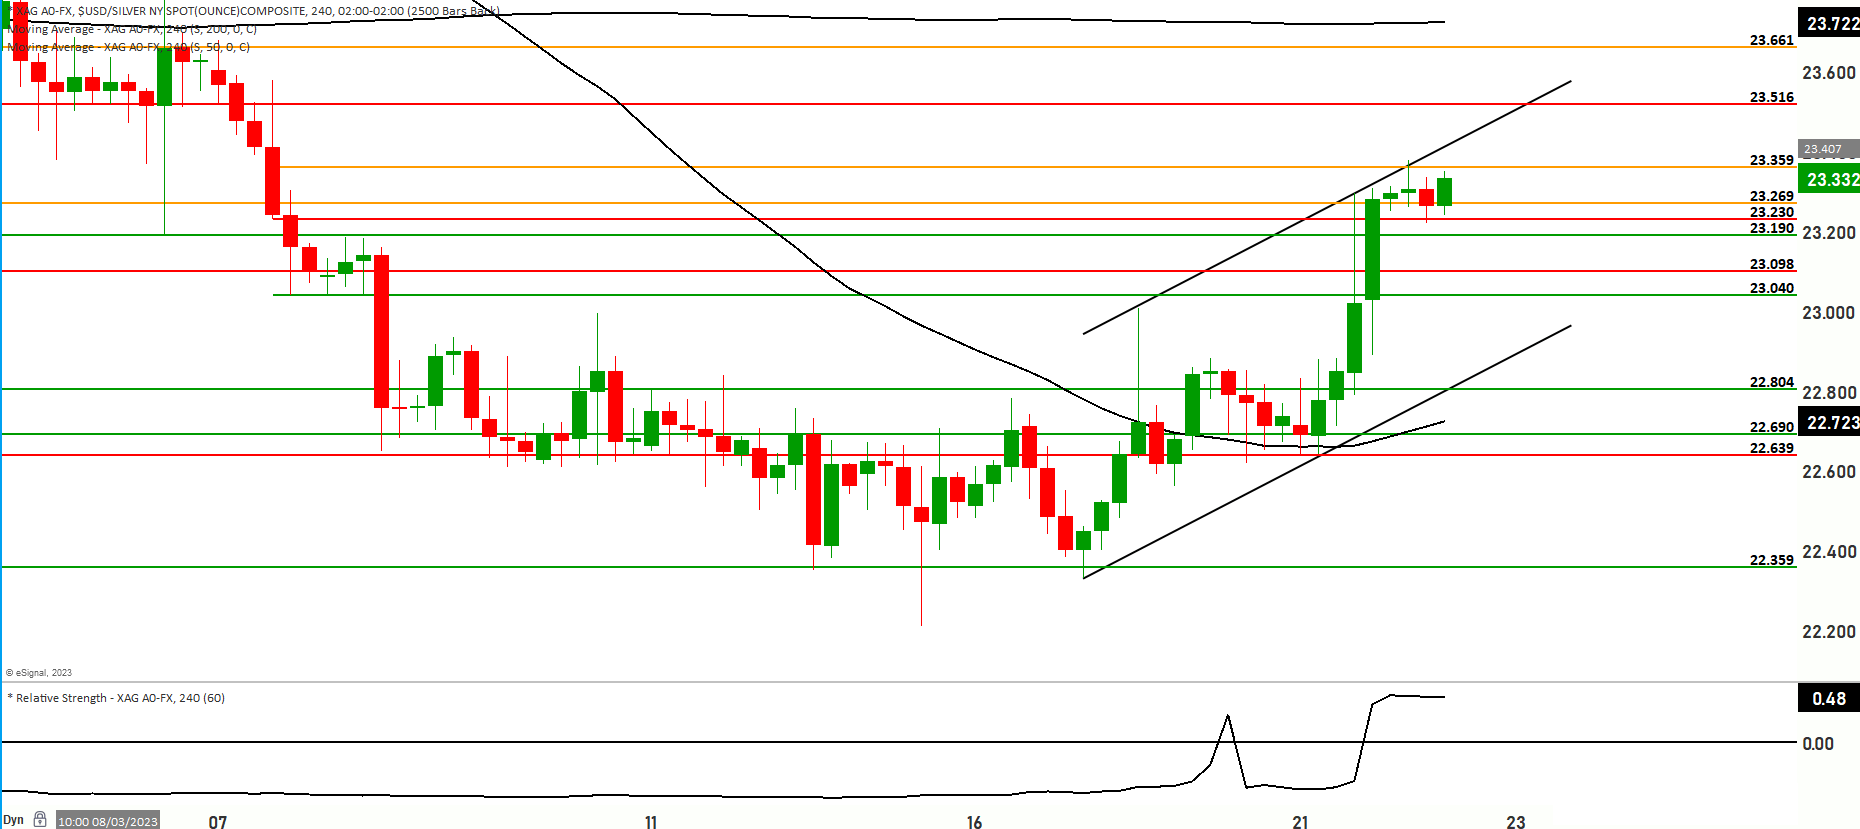
XAG/USD Trend: Navigating a bullish Range-Bound Market targeting the major Resistance at 23.516


Currently, the price of silver is exhibiting a bullish trend within a certain price range, with its value positioned at the 23.274 mark. This price point falls between two key indicators in the market analysis, specifically the 50-day and 200-day Moving Averages. This positioning indicates a sentiment of range-bound trading, where the price movement is constrained within a specific range rather than showing significant upward or downward trends.
There are two primary scenarios that could potentially unfold based on the current market conditions:
Scenario 1: In this scenario, there is a possibility that the price of silver might experience a decline in value. This decline could lead to a testing of support levels at 23.098 and 22.985. Should this testing be successful and the price continues to decline, there is potential for a further drop to the 22.804 level. It’s worth noting that the 22.690 level is of particular importance in this context, as it represents a crucial support level that warrants close monitoring.
Scenario 2: On the other hand, there exists an alternative scenario in which the price of silver might ascend from its current level. This ascension could result in a retesting of the 23.378 level, with the possibility of encountering resistance at the 23.516 level. If upward momentum persists beyond this resistance, it might lead to a testing of higher price points such as the 23.661 level. Moreover, the 23.829 level holds considerable significance as a major point of interest. It not only serves as an uppermost resistance level but also plays a significant role in influencing the market’s future trajectory.
However, it’s crucial to approach the current market conditions with a sense of caution. There is a likelihood that the market might oscillate within the price range of 22.592 to 23.661. The behavior of the market within these bounds will play a pivotal role in determining its future course of action.
The momentum analysis for the market reveals that it currently resides in a state of equilibrium, with neither strong bullish nor bearish momentum dominating.
Key levels to watch are 23.341,23.098,22.804,23.516,23.661,23.829
| Levels | Support | Resistance |
|---|---|---|
| Level 1 | 23.098 | 23.398 |
| Level 2 | 22.966 | 23.516 |
| Level 3 | 22.804 | 23.661 |
