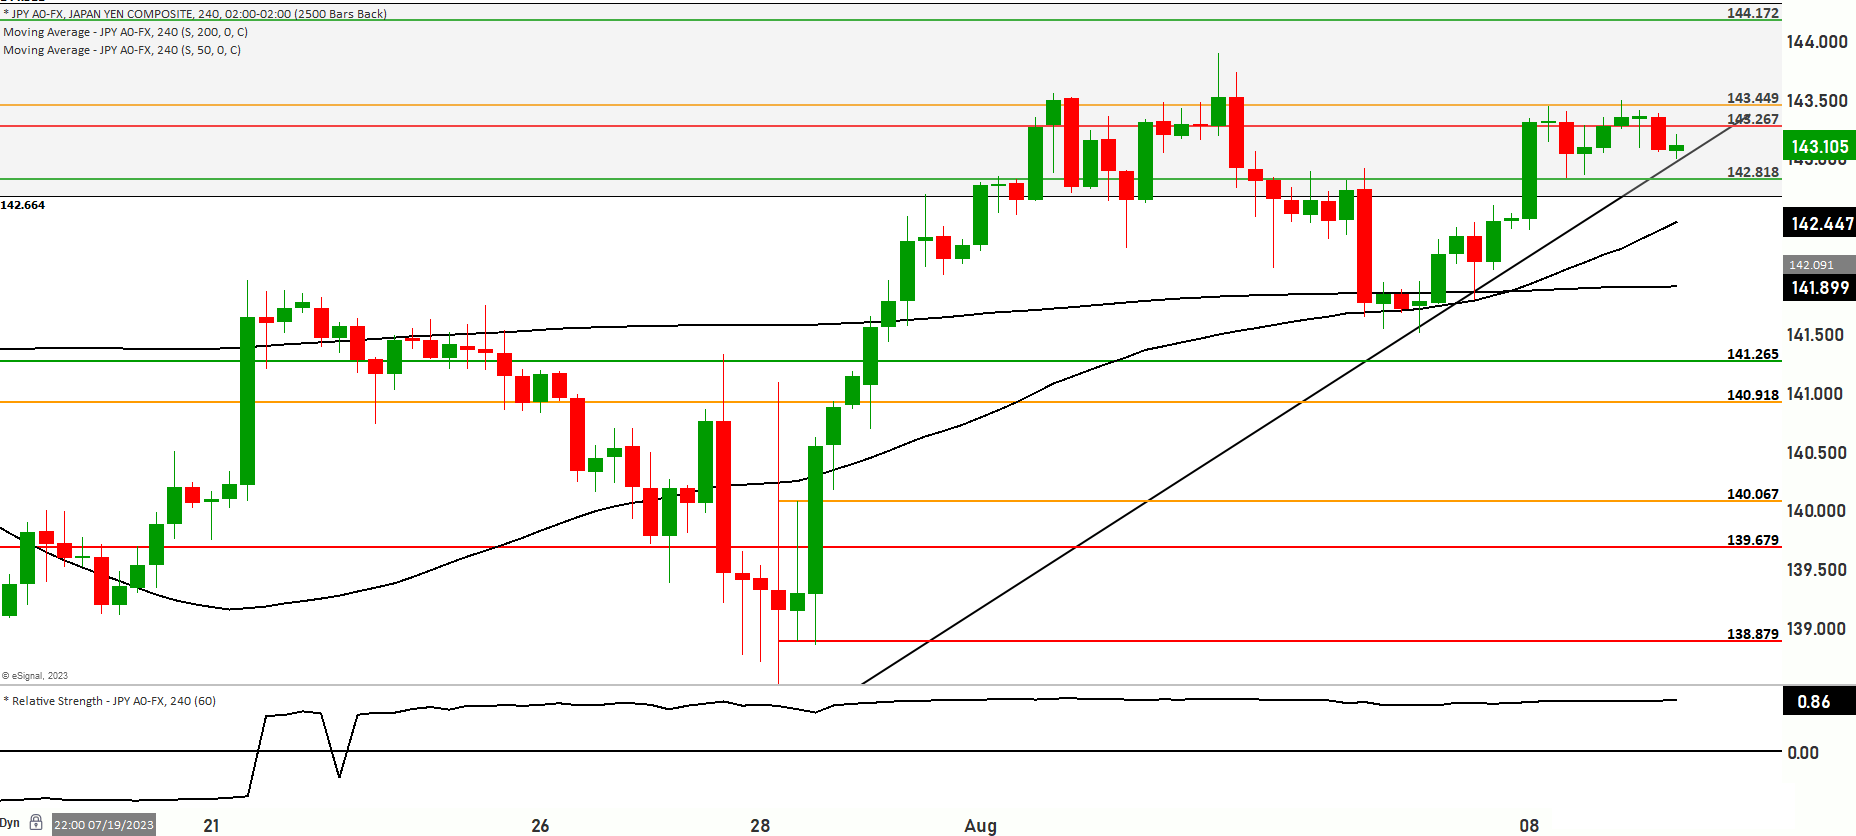

USD/JPY currently trades at 143.223, prompting an analysis of its price and momentum dynamics.Price is above the 200-day and 50-day Moving Averages, indicating a notable insight – bullish sentiment in a range-bound scenario.
Scenario 1: Upside Potential
A bullish outlook presents itself. With sustained momentum, retesting the 143.449 to 143.651 range is conceivable. Further progress may aim for 143.890, potentially reaching the 144.172 to 144.488 level. Pinnacle resistance stands at 144.895.
Scenario 2: Downside Prospects
Contrarily, a downside scenario envisions probing 142.818. Success could lead to more decline towards 142.557, followed by attention to 141.872 and notably, the pivotal 141.265 support.
While a bullish stance is prominent, a pullback from recent highs implies complexity. The market’s overbought hints are bolstered by an RSI close to the overbought region, suggesting potential for a bearish reversal.
This USD/JPY assessment delves into price levels, moving averages, and momentum. The price above moving averages signifies nuanced bearish momentum within a range-bound context. Scenario outcomes vary, with potential resistance retests against downside support, all emphasizing key levels. Fluctuating between bullish momentum and overbought signals
Key levels to Watch are 144.488,144.895,142.237,142.818
| Levels | Support | Resistance |
|---|---|---|
| Level 1 | 143.020 | 143.875 |
| Level 2 | 142.818 | 144.488 |
| Level 3 | 141.265 | 144.895 |
